Introduction
In this post, I’ll be implementing K-Means clustering from scratch in Python. This is the seventh post in the “Machine Learning from Scratch” series.
K-Means is one of the most popular unsupervised learning algorithms used for clustering data into groups based on similarity. Unlike the previous algorithms in this series, K-Means doesn’t require labeled data.
K-Means Clustering
K-Means is an unsupervised algorithm that partitions data into K distinct clusters. Each data point belongs to the cluster with the nearest centroid (cluster center).
The algorithm works iteratively:
- Initialize K centroids randomly
- Assign each data point to the nearest centroid
- Update centroids by computing the mean of all points assigned to each cluster
- Repeat steps 2-3 until convergence
The algorithm minimizes the within-cluster sum of squares, making clusters as compact as possible.
Implementation
I’m using numpy for numerical computations and matplotlib for visualization. For testing, I’ll use make_blobs from scikit-learn to generate clustered data.
The KMeans class has the following methods:
__init__: Constructor to set the number of clusters K and maximum iterations.fit: Method to run the K-Means algorithm.predict: Method to assign data points to the nearest cluster.
import numpy as np
from sklearn import datasets
import matplotlib.pyplot as plt

class KMeans:
    def __init__(self, K=3, max_iters=100):
        self.K = K
        self.max_iters = max_iters
        self.centroids = []
        self.clusters = [[] for _ in range(self.K)]

    def fit(self, X):
        self.X = X
        self.num_samples, self.num_features = X.shape

        random_sample_idxs = np.random.choice(self.num_samples, self.K, replace=False)
        self.centroids = [self.X[idx] for idx in random_sample_idxs]

        for _ in range(self.max_iters):
            self.clusters = self._create_clusters(self.centroids)
            centroids_old = self.centroids
            self.centroids = self._get_centroids(self.clusters)

            if self._is_converged(centroids_old, self.centroids):
                break

    def _create_clusters(self, centroids):
        clusters = [[] for _ in range(self.K)]
        for idx, sample in enumerate(self.X):
            centroid_idx = self._closest_centroid(sample, centroids)
            clusters[centroid_idx].append(idx)
        return clusters

    def _closest_centroid(self, sample, centroids):
        distances = [self._euclidean_distance(sample, point) for point in centroids]
        closest_index = np.argmin(distances)
        return closest_index

    def _get_centroids(self, clusters):
        centroids = np.zeros((self.K, self.num_features))
        for cluster_idx, cluster in enumerate(clusters):
            cluster_mean = np.mean(self.X[cluster], axis=0)
            centroids[cluster_idx] = cluster_mean
        return centroids

    def _is_converged(self, centroids_old, centroids):
        distances = [
            self._euclidean_distance(centroids_old[i], centroids[i])
            for i in range(self.K)
        ]
        return sum(distances) == 0

    def _euclidean_distance(self, x1, x2):
        return np.sqrt(np.sum((x1 - x2) ** 2))

    def predict(self, X):
        labels = np.zeros(len(X))
        for idx, sample in enumerate(X):
            labels[idx] = self._closest_centroid(sample, self.centroids)
        return labels
Now let’s test the model on synthetic clustered data.
if __name__ == '__main__':
    X, _ = datasets.make_blobs(
        n_samples=500, n_features=2, centers=3,
        cluster_std=1.0, random_state=42
    )

    model = KMeans(K=3, max_iters=100)
    model.fit(X)
    labels = model.predict(X)

    fig = plt.figure(figsize=(8, 6))
    plt.scatter(X[:, 0], X[:, 1], c=labels, cmap='viridis', s=40)

    for centroid in model.centroids:
        plt.scatter(centroid[0], centroid[1], marker='x',
                   color='red', s=200, linewidths=3)

    plt.show()
Let’s visualize the clustering results:
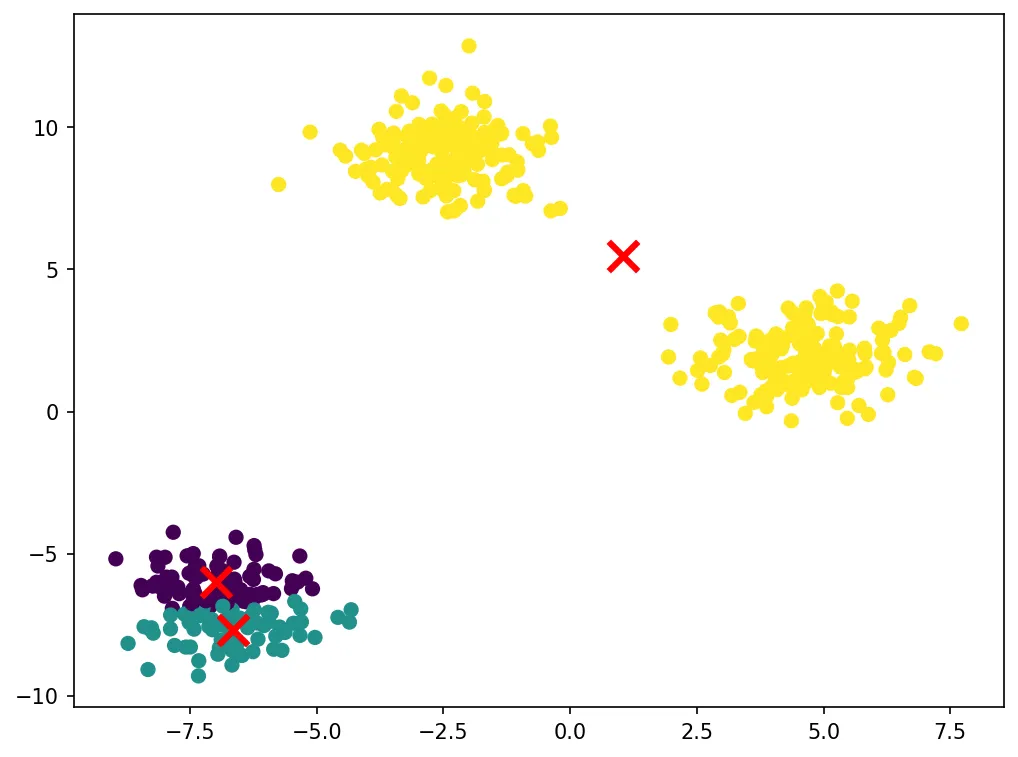
The algorithm successfully identifies the three clusters in the data. The red X marks show the final centroid positions. K-Means works well when clusters are roughly spherical and similar in size.
That’s all for this post. Thanks for reading!